
Case study · Real estate
BizFin
Performance Dashboard App for Real Estate Teams
BizFin helped real estate agents and team leaders run the numbers on their business with a set of spreadsheet models. We turned those models into AgentOps, a subscription web app with guided setup, bulk data import, seven interactive reports, a leaderboard for the office TV and an API for Zapier, and took it to production in about four months.
Overview
BizFin works with residential real estate agents and team leaders on the business side of selling homes: which lead sources pay off, whether the team is on pace for its goals, and what is left after splits, marketing and overhead. It started as consulting, built on a set of Excel models that later became Google Sheets its clients used.
Clients kept coming back for the spreadsheets more than the advice, so BizFin decided to turn them into software. We designed and built that product, AgentOps, as a web app on Laravel and React, took it from kickoff to a production launch in about four months, then kept extending it through the first half of 2020.
The Challenge
The models had proven themselves with paying clients, but they were manual. An agent had to enter sales, marketing spend and expenses in the right format, and the math behind the reports (commission splits, referral fees, goal pacing, return on each lead source) lived in spreadsheet formulas.
The app had to do that math on its own and still feel quick to a busy agent. It also had to handle three kinds of users: an individual agent, a team leader, and the team members who report to that leader, where team goals are split across members and every sale follows a commission waterfall from brokerage to leader to agent.
What We Built
Setup that captures the model up front
A guided setup checklist walks a new account through sales goals, lead sources with their costs and splits, and the team roster. Team goals are distributed to each member by month, and any member's goal can be overridden. Facebook sign-in and Stripe billing with monthly and annual plans are part of registration.
Inputs that do the math
Adding a sale runs the commission calculation on the spot, including splits by lead source, referral fees to an agent or to the company, and extra expenses on the deal. Pending sales are tracked separately until they close. Monthly marketing spend and lead counts, operating expenses, and leads claimed by each agent each have their own input screens.
Bulk upload for data that already exists
Customers came with their history already in spreadsheets. We built CSV and Excel uploads for transactions, marketing activity, expenses and team members, with validation and duplicate checks, then added Flatfile when users struggled to match the template format, so they could map their own columns instead.
Seven reports that explain themselves
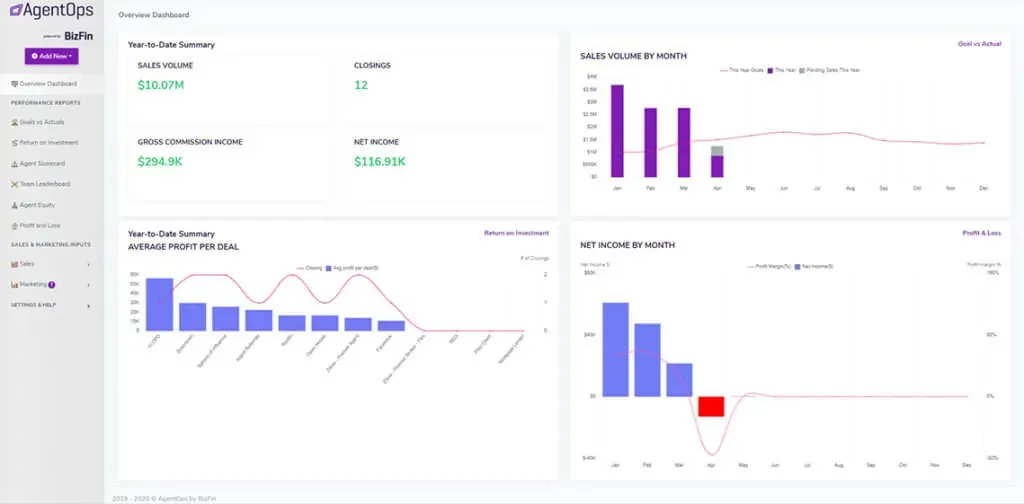
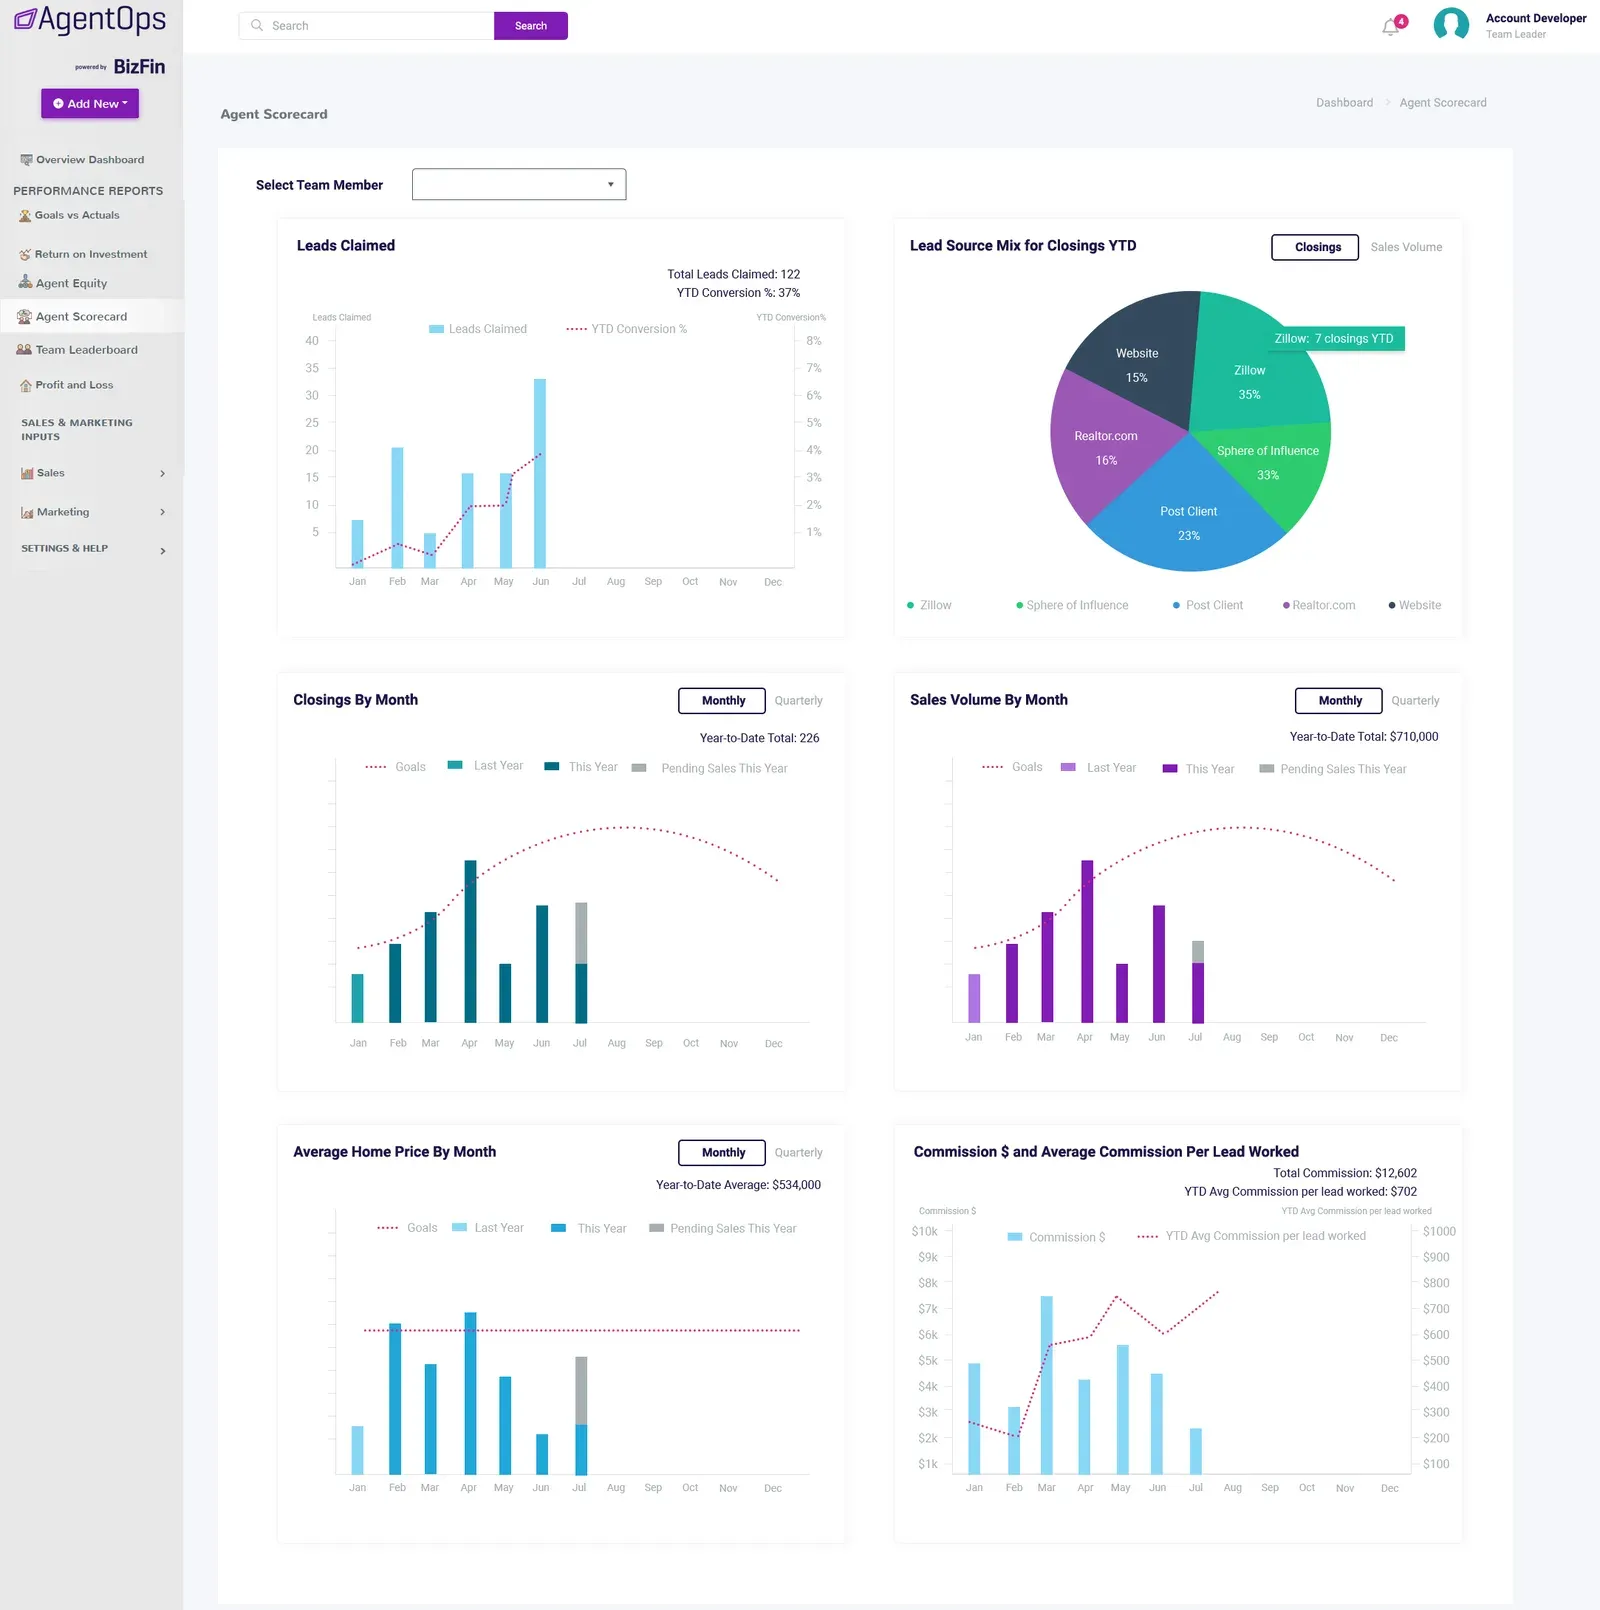
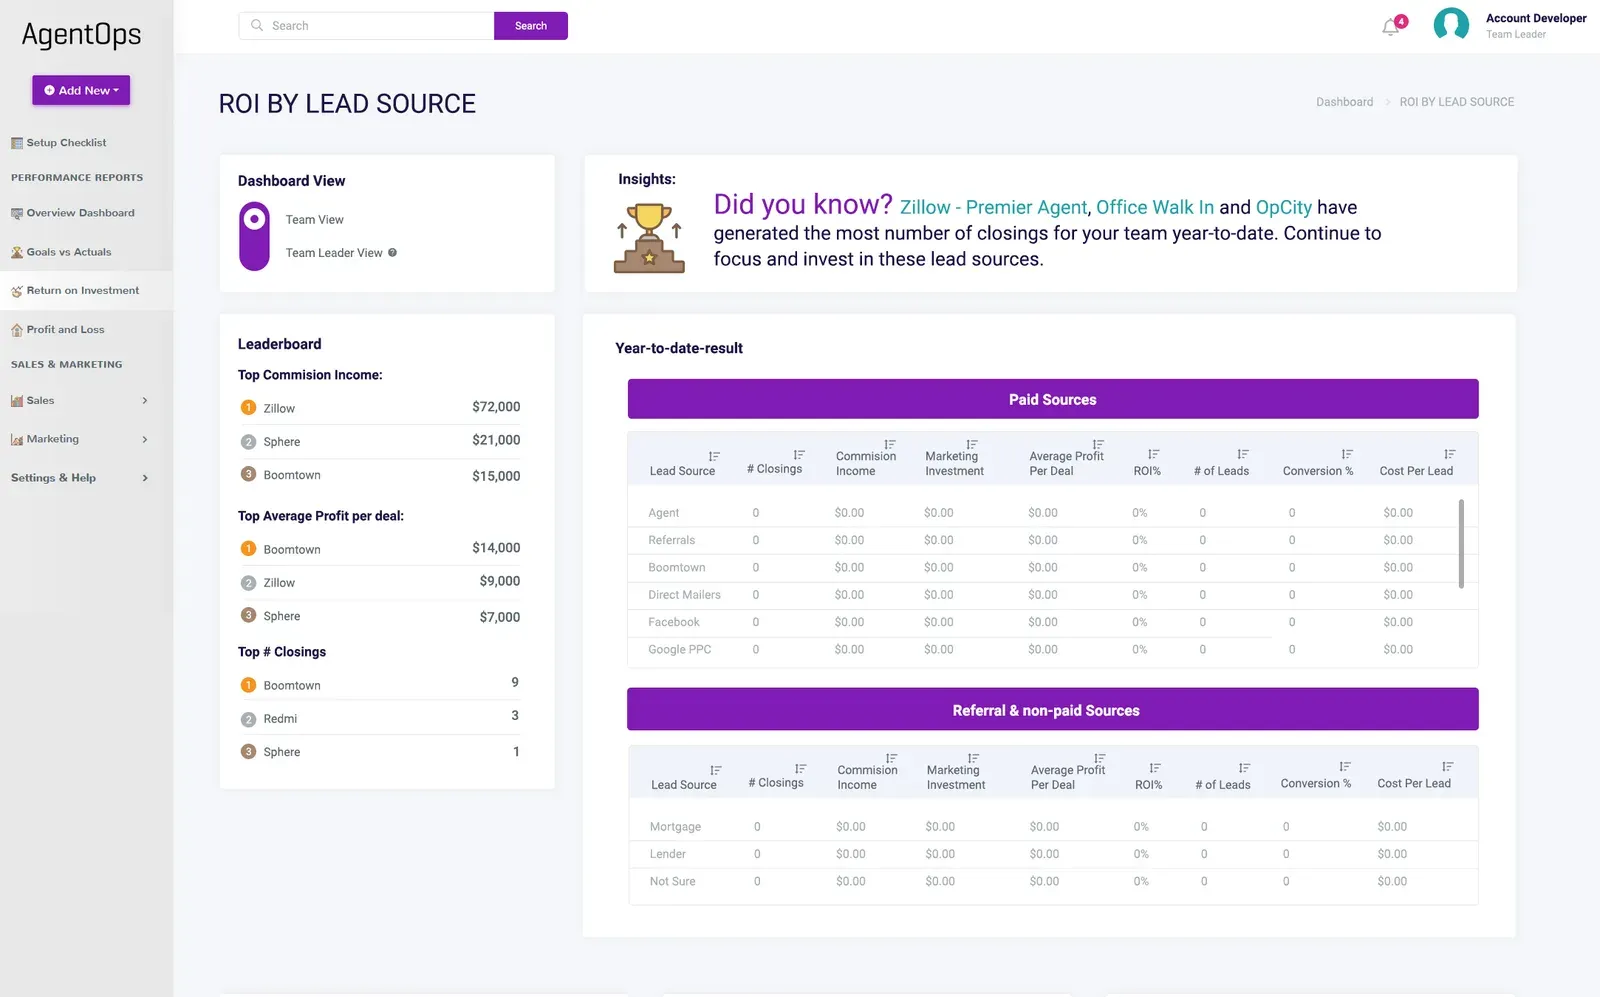
An overview dashboard pulls from Goals vs Actuals, ROI by Lead Source, and Profit and Loss. Agent Equity, Agent Scorecard and Team Leaderboard break the numbers down by person. The charts are interactive and filter by time frame, and the main reports open with a sentence written from the data, such as which lead sources produced the most closings this year.
A leaderboard for the office TV
BizFin wanted something team leaders could put on the office TV. The leaderboard has a presentation mode that runs full screen and rotates through closings, sales volume and pacing to goal, highlighting the top agents on each slide.
Nudges, an admin console and an API
A notification center flags pending sales past their closing date and months with no data entered. BizFin staff got an admin console with an account list and the ability to sign in as a customer to help them. We built and documented the API that the Zapier integration connects to, so data can arrive from other tools without manual entry.
Tested where the math matters
Browser tests cover sign-in, team members and sales entry, and feature tests check goal calculations and ROI reporting, alongside manual QA checklists built from known test data.
Results
- A spreadsheet-based consulting model turned into a subscription web app, launched to production in October 2019, about four months after kickoff.
- Seven interactive reports that do the commission, goal, ROI and profit and loss math automatically, with written insights on the main ones.
- Existing customer data imported through bulk upload with column mapping, instead of rekeyed by hand.
- An API for Zapier, Stripe billing, and admin tools that let BizFin support its own customers.