Improving WordPress performance can be difficult. However, with the right approach, you can see pretty good improvements to PageSpeed Insights and GT Metrix scores.
The Problem
There are a lot of variables that impact website speed and performance.
First, what platform was used for the website? WordPress currently has over 25% of the market share on the internet, but has a number of inefficiencies that can make it slow.
Second, in addition to wordpress, your theme can have a big impact. Are you using a page builder like Divi, Elementor, or WP Bakery? These page builders are nice for building pages but add additional bulk.
Third, your plugins can slow down your site. Because of the way WordPress utilizes actions and hooks, as it begins rendering a page, it will get interrupted dozens if not hundreds of times by plugins.
And if that’s not enough, if you’re integrating third party tools like Google Analytics, Facebook tracking pixels, or web forms from your Customer Relationship Management (CRM) system (like Salesforce or Hubspot), they usually load javascript and inject html which can slow down your site.
In short, as you add more functionality to your site, your site gets slower.
Initial Scores
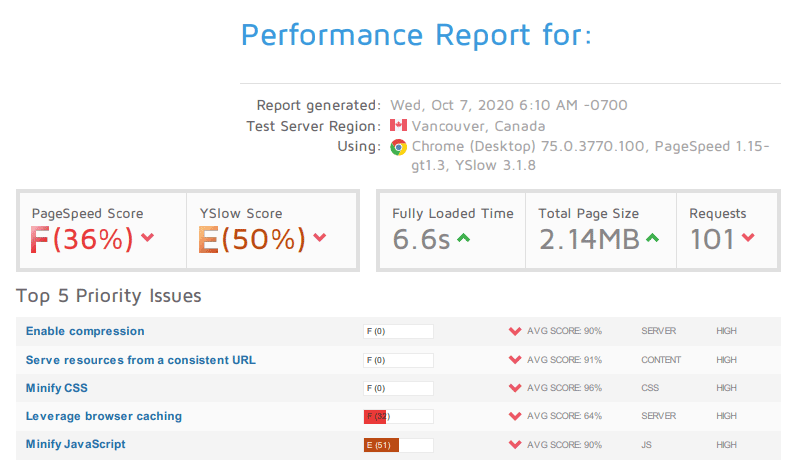
For the site in question (site name hidden to protect the innocent, hah!), scores started initially as follows:

As you can see here, the overall score was an F. The site was taking 6.6 seconds to load.
There were a number of things to fix: compression on images, inconsistent URLs, and css minifaction to name a few, as well as a lack of caching.

Initial PageSpeed Insights Mobile Score
Initial scores on mobile were horrendous as well. The first content paint was even worse through Pagespeed Insights at 11.7 seconds. That means 11.7 seconds for the page to load and start rendering. The page wasn’t interactive (meaning that you couldn’t start clicking on the page) for almost 20 seconds.

Desktop scores in Pagespeed Insights was a little better, probably because Google tests mobile first. If the server has some form of caching, rather through Apache or PHP Opcache, it will load the second time a bit faster.
Overall, this was pretty poor, but on the flip side, we saw a lot of room for improvement for our customer.
Improving GT Metrix Scores
Looking at the GT Metrix score, it was obvious a 6.6 second load time wasn’t going to cut it. Fortunately, GT Metrix spells out the issues in their report, giving us some items to focus on.
First, we enabled a caching solution in WordPress called W3 Total Cache. Out of the box, it can improve load times significantly. However, the initial settings are a bit conservative, only because there are certain issues like the order that assets load. For example, many Javascript code snippets depend on another library called JQuery. If JQuery doesn’t load before these snippets load, then they can’t execute.
By understanding the different assets that need to load on the site, we were able to choose which Javascript libraries should load first, and which ones could load later.
Minifying and combining css and javascript also makes a big difference. By doing both of these, we were able to reduce the number of files (and the size of those files). As you see from the initial GT Metrix report, there are 101 requests needed to load this page. After tweaking, we reduced the number of requests to load the home page to under 50.
In addition, we updated the WordPress core to the latest version, which includes many speed updates. We also removed any unused plugins, and consolidate plugins in some cases, while upgrading others. We installed WP Rocket and Optimole, two great plugins for optimizing image sizes and improving performance.
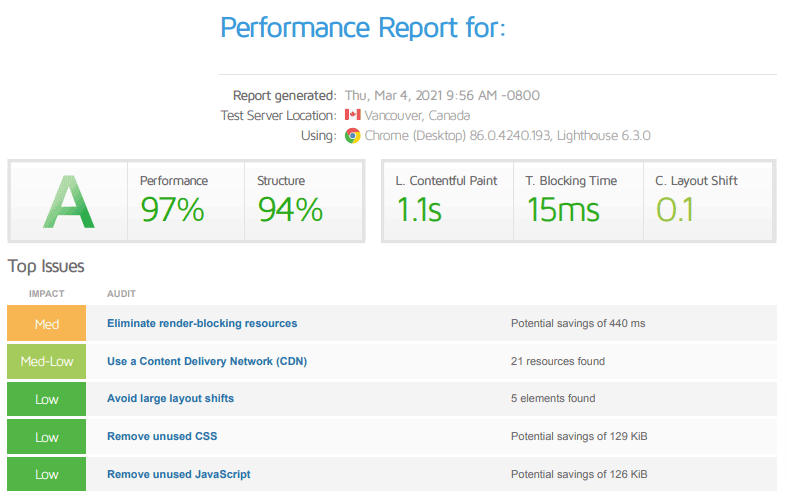
When we were done, we ended up with this final score:

Improving PageSpeed Insights Scores
By nature of the changes for GT Metrix, we naturally improved PageSpeed Insights. In particular, the theme authors have become much more sensitive and aware of their performance through tools such as PageSpeed Insights and GT Metrix. Not wanting to lose out on customers because of a slugish theme, they’ve been quite proactive in optimizing their themes to improve speed.
The same holds true with plugins and, of course, with the WordPress core. Optimal speeds means better scores and better customer satisfaction.
However, while these did improve things, we still had several other improvements to make.
Example of these include:
- Optimizing image sizes
- Setting minimal heights where applicable to avoid page jumps on page load which improves Cumulative Layout Shift (CLS) scores
- Turning on static file options in the theme settings for stylesheets (css)
- Delaying the loading of certain javascript assets that are non-critical to avoid unnecessary CLS movement
- Giving static containers to third party html injectors like a javascript form from Hubspot (CRM)
- Update font loading and stylesheets so fonts and styling are consistent and font libraries are available before First Content Paint (FCP)
- Add a fixed height to certain image containers to avoid jumping
- Remove unnecessary javascript from pages where it’s not used (for example, don’t load Hubspot javascript on pages that don’t have a Hubspot optin form)
- Setting certain images to lazy load
- Enabling additional caching through Cloudflare
- Forcing margins/padding on certain elements early in the load process instead of waiting on the theme stylesheets to load
And <drumroll>…. here’s the final score:


Final Thoughts
Yes, we were pretty happy with the results. I feel like the mobile scores could be better, and we have another round of changes we’re making to try and improve these.
But really, for a site running Divi on WordPress with several third party integrations, this is pretty fantastic.
Mobile is extremely difficult because even a minimal amount of CLS (content movement as the page loads) impacts mobile scores more than desktop.
For example, an icon in the top right of the page might not cause any jumping on a desktop view at 1920×1080, but at a mobile resolution of 360×640, the icon is now stacked below the content at the top left of the page, and therefore its vertical margins and padding have an impact on elements that aren’t impacted on a wider resolution.
Not only that, but again, page builders are really difficult to optimize. For example, WP Bakery and Divi are really difficult to optimize. We’ve noticed that Elementor seems to handle things better, but it still can vary based on the complexity of the site.
Overall though, our work on site optimization had a very significant impact on our customers’ SEO initiatives as well as other metrics like bounce rate and time on site.
